
General Information and Purpose
"The first and last measure of good government is citizen satisfaction." That sentence is a key statement regarding the National Citizen Survey. The City of Paducah contracted to use the National Citizen Survey to gather feedback from citizens about city services, civic participation, public trust, and various community topics in 2013, 2016, and 2018. The International City/County Management Association (ICMA) and the National Research Center, Inc. (NRC) developed the survey.
The survey data helps elected officials and directors prioritize services and guide future decision-making reflective of the desires of the community. The results also serve as a management tool to improve operational level systems and performance. The results provided City leaders a wealth of benchmarking data that allows Paducah to be compared with communities across the nation. By using a standardized survey tool, the entire process can be conducted effectively within tight financial constraints.
The multiple-choice survey asked questions including how often do you visit the city’s website, how safe do you feel in your neighborhood, and how often do you recycle. Citizens also rated various city services. Individual answers were anonymous, but the compiled statistical survey results were shared with the public.
2018 National Citizen Survey - Results Show High Quality of Life in Paducah
In 2018, the National Citizen Survey was mailed to 1500 randomly-selected households within the Paducah city limits. The survey asked questions about a community’s livability which includes city services, civic participation, governance, and various community characteristics.
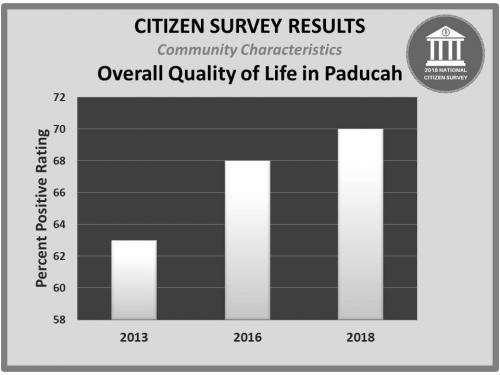
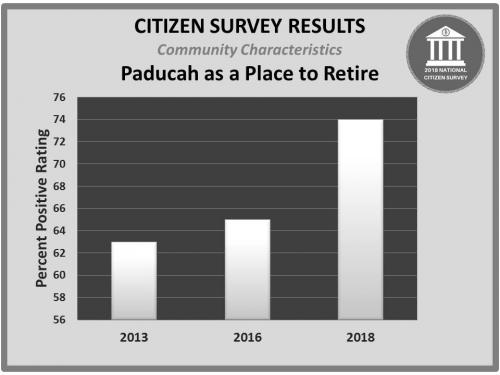
On the conclusion page in the Community Livability report, it states, “Paducah residents continue to enjoy a high quality of life and feel more positively about Paducah as a place to retire than in past survey years.”
The percent of positive responses for the question asking about the overall quality of life in Paducah jumped from 63% positive in 2013 to 68% positive in 2016 and to 70% positive in 2018. Regarding Paducah as a place to retire, the percent of positive ratings increased from 63% in 2013 to 65% in 2016 with a significant jump to 74% in 2018.
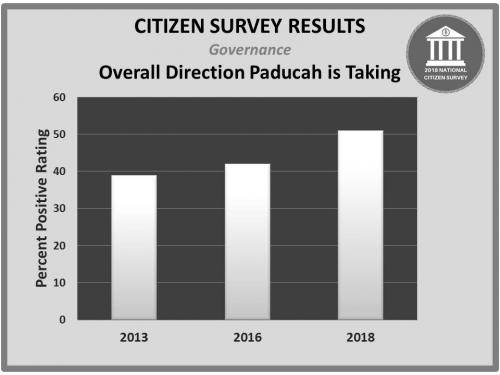
Of the 134 items for which comparisons were available, 109 items were rated similarly in 2016 and 2018, and 23 items showed statistically significant increases in ratings of more than seven percentage points. Those increases were in categories including Paducah as place to retire, the value of services for taxes paid in Paducah, the overall direction of Paducah, recycling opportunities, economic development, and recreation programs.
A couple of other questions with noteworthy increases focused on governance and participation. When asked to rate the overall direction that Paducah is taking, the positive responses increased from 39% in 2013 to 42% in 2016 and to 51% in 2018. Regarding the question about how likely you would recommend living in Paducah to someone who asks, the positive responses increased from 75% in 2013 to 78% in 2016 and to 82% in 2018.

Pillars and Facets
The National Citizen Survey gathers feedback from citizens about the three pillars of a community: Community Characteristics, Governance, and Participation. The pillars are further divided into eight facets: Safety, Mobility, Natural Environment, Built Environment, Economy, Recreation & Wellness, Education & Enrichment, and Community Engagement. Each question on the survey is connected to a pillar and facet.
Safety Facet Results - In rating their feeling of safety in their neighborhood during the day in Paducah, the results show that 91% of Paducah's citizens rated their feeling of safety as very safe or somewhat safe. Paducah received a 90% positive rating in 2016 with an 88% positive rating in 2013. Regarding the quality of Fire Services, the percent of positive responses (excellent or good) maintained a high percentage of 90% for 2018 and for 2016. Paducah received an 87% positive rating in 2013.
Mobility Facet Results - The Mobility facet addresses the various ways to travel through a city including the transit system, walking and bicycle paths, sidewalks, and streets. The question that saw the greatest positive change between 2018 and 2013 is the question that asks citizens to rate the availability of paths and walking trails in Paducah. In 2013, the results showed that 43% rated the availability of paths and walking trails as either excellent or good. However, that number increased to 54% in 2016 and to 55% in 2018.
Natural Environment Results - There are several questions associated with the Natural Environment facet including air quality, cleanliness, drinking water, and the collection of garbage and yard waste. One of the questions that saw significant change between 2018 and 2013 is the question that asks citizens to rate the quality of the overall natural environment in Paducah. In 2013, the results showed that 55% rated the quality of Paducah’s natural environment as either excellent or good. However, that number increased to 68% in 2016 and to 71% in 2018. Regarding the quality of recycling services in Paducah, between 2016 and 2018, the percentage of positive responses increased from 31% to 46%. The City of Paducah launched a voluntary, curbside, single-stream recycling program for its residential customers in January 2018.
Built Environment Results - One of the questions that saw significant change between 2018 and 2013 is the question asking citizens to rate the overall quality of new development in Paducah. In 2013, the results showed that 39% rated the quality of Paducah’s new development as either excellent or good. That number increased to 46% in 2016 and to 53% in 2018. Another question in the Built Environment facet that has had significant positive change asks about the quality of the land use, planning, and zoning services. Between 2016 and 2018, the percentage of positive responses increased 10 percentage points from 35% to 45%.
Economy Facet Results - The question that asked citizens to rate the vibrancy of Paducah’s downtown area resulted in a higher than average benchmark rating. Between 2016 and 2018, the percentage of positive responses increased 6 percentage points from 59% to 65%. Regarding the question asking citizens to rate the quality of economic services, the survey is showing an upward trend for the Paducah area. In 2013, this question resulted in a 27% positive response. That number increased to 34% in 2016 and to 42% in 2018.
Recreation & Wellness Results - The question in this category that saw one of the largest increases in positive results asked citizens to rate the quality of the recreation programs in Paducah. In 2013, this question resulted in a 58% positive response. That number increased to 64% in 2016 and to 72% in 2018. Regarding how often a citizen visits a park, the survey shows that 87% visit a city park at least once a month. That number has remained stable over time with the results from the previous surveys showing 89% in 2013 and 86% in 2016. Recreation & Wellness is a category that has seen significant increases since Paducah began surveying its residents. In 2017, the City of Paducah received the Voice of the People Award for Transformation in Recreation & Wellness. Compared with all of the communities that participated in the 2016 National Citizen Survey, Paducah residents reported the highest levels of improvement in the Recreation & Wellness category.
Education & Enrichment Results - One of the questions in this category asks residents to rate the opportunities to attend cultural, arts, and music activities in Paducah. This question has had significant increases in positive results since the question was asked of Paducah residents in the 2013 National Citizen Survey. In 2013, this question resulted in a 50% positive response. That number increased to 69% in 2016 and to 75% in the 2018 survey. With the 75% positive responses, Paducah is higher than the benchmark, a comparison to other cities across the nation that recently took this survey. An impressive result in the Education & Enrichment facet focuses on the McCracken County Public Library. The Library has had 81%, 82%, and 87% positive results in the 2013, 2016, and 2018 surveys respectively. Regarding K-12 education, the positive results are trending upward with the results increasing from a 64% in the 2013 survey to 79% in 2018.
Community Engagement Results - One of the survey questions asked citizens to rate their confidence in city government. Paducah’s numbers increased in 2018 by 11 points as compared to the 2016 survey. Another question that showed an impressive upward trend asked citizens to rate their opportunities to participate in community matters. This question had a ten point increase with the positive results increasing from 53% in the 2016 survey to 63% in 2018.
Survey Timeline and Reports
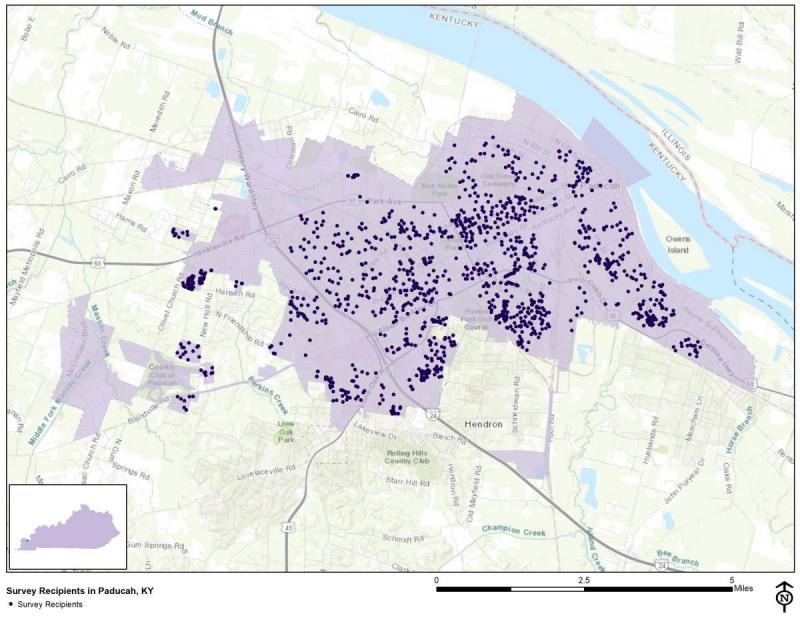
The process involved the mailing in May of pre-notification cards and surveys to 1500 randomly-selected Paducah households (see map) with a new feature offered by the NRC, an opt-in web survey to collect additional community responses. Community members who did not receive a mailed survey were encouraged to complete the survey online until June 20. Once a household received the survey, the adult in the household who most recently had a birthday was asked to complete it. This is an unbiased way of selecting the survey participant allowing the results to be representative of the community.
The majority of the survey is standard so that cities can benchmark and compare their results directly to other cities. However, each city that uses the survey is allowed nearly a page of customized questions. For this survey, Paducah asked custom questions relating to storm water, sidewalks, and the importance of specific neighborhood qualities and features.
Paducah received the finalized reports in August. The survey instrument and compiled statistical survey results are below.
2018 Survey Instrument
Community Livability Report (GOOD to READ)
Trends Over Time Report (GOOD to READ)
Demographic Crosstabs Report
Supplemental Online Results (online survey respondents only)
Dashboard Results Summary
Technical Appendices (includes National and Southern Benchmark Comparisons)
Voice of the People Award
On October 23, 2017, during the Celebration of Service Reception, the National Research Center, Inc. (NRC) and the International City/County Management Association (ICMA) presented the City of Paducah the 2017 Voice of the People Award for Transformation in Recreation and Wellness. The reception was part of the 103rd Annual ICMA Conference in San Antonio, Texas. The City of Paducah surveyed residents in 2016 and in 2013 using The National Citizen Survey™. Compared with all of the communities that participated in the 2016 surveys, Paducah residents reported the highest levels of improvement in the category of Recreation and Wellness. According to the NRC, this competitive award is given only to top performing jurisdictions that best listen and act for the benefit their communities.
In comparing the two survey results, Paducah noticed statistically significant increases in the following community characteristics: paths and walking trails, overall natural environment, and recreational opportunities. Paducah also noticed that the positive ratings for using Paducah recreation centers and visiting a city park increased in the three-year span between surveys. To further validate the increase in ratings between surveys, Paducah reviewed its rating trend for quality of life. For the 2016 survey, 68 percent of Paducah’s residents gave positive ratings regarding the overall quality of life in Paducah. That number increased from the 63 percent approval rating in 2013. According to the National Research Center, this is an impressive increase since a variety of factors come into play when looking at quality of life.
The Voice of the People Awards stand alone as the only awards given in local government based on community opinion. Survey results determine the nominees for the best in the following categories: Community Engagement, Safety, Mobility, Foundations of Livability, Recreation and Wellness, Education and Enrichment, Natural Environment, Built Environment, and Economy.
2016 Citizen Survey
The City of Paducah contracted in 2016 to use the National Citizen Survey through the National Research Center, Inc. (NRC) to gather feedback from citizens about city services, civic participation, characteristics of Paducah, and various community topics. The five-page multiple-choice survey, developed by the International City/County Management Association (ICMA) and the NRC, included 163 standard questions and general demographics questions. It was sent to 1400 randomly selected Paducah households. The City of Paducah had a return rate of 29% with the completion of 370 surveys. In order to get an accurate return rate, the number of surveys mailed to empty apartments or vacant homes was subtracted from the initial value of 1400. The NRC expects a return rate of 25-40% for a statistically valid sample.
On July 27, 2016, the Paducah Board of Commissioners along with the City Manager and City directors participated in the Next Steps Workshop led by the National Research Center (NRC).
Survey Instrument for Paducah, Kentucky (2016)
Next Steps Workshop Slideshow Presentation
The five reports for Paducah created by the NRC are as follows:
Community Livability
Trends Over Time
Dashboard of Findings
Demographic Report
Technical Appendices